
People around the country can pass judgment on their government Nov. 6 in the first national election in two years — if they’re registered to vote, and cast a ballot.
Many will not, if recent history holds true. Only about 60 percent of U.S. adult citizens voted in the last national election, a turnout that ranked in the bottom third of the world’s developed countries.
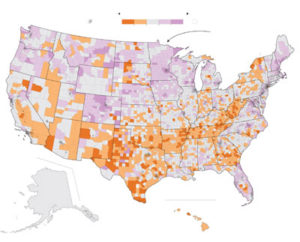
Share of adult citizens who voted in 2016
Average turnout Lowest Highest Population No data 45% 55 65 75 Minnesota has the highest statewide turnout (74%), followed by Colorado (73%) and New Hampshire (72%). Seattle
WASH., MAINE, MONT., N.D., VT.,
MINN.,ORE., N.H., Boston, Minneapolis, S.D.,
IDAHO, WIS. MASS., N.Y., MICH. R.I., CONN.,
,WYO., Detroit, New York, Chicago, PENN., Salt Lake City, IOWA,
N.J., NEB., San Francisco, NEV., OHIO, MD., DEL., IND., Denver, ILL., Washington, D.C., UTAH, COLO. W.VA., St. Louis, CALIF., VA., KAN., MO., KY., N.C., TENN., Los Angeles, ARIZ., OKLA., S.C. ARK., Atlanta, N.M., Phoenix, GA., Dallas, MISS., ALA., LA., TEXAS, Houston,
FLA., ALASKA, Miami, HAWAII, Hawaii had the lowest
statewide turnout (43%), followed by West Virginia (50%) and Tennessee (51%).
Note: Alaska, represented with statewide data, had 60% turnout.
Turnout in 2016 was especially low in almost a thousand U.S. counties. Most of them form a geographic belt that curves from upstate New York, down along the Appalachians, across Tennessee and into the Southwest. But 2018 has brought statewide races predicted to be competitive to the heart of the low-voting belt, in West Virginia, Tennessee, Oklahoma, Texas and New Mexico. The November results will be studied for signs of closer races and greater voter involvement to come in 2020.
These maps show a turnout percentage based on two numbers for each county: ballots cast in the 2016 presidential race and the estimated population of voting-age citizens. Among the low-voting counties, those with turnout of 55 percent or less, there are some striking differences.
For example, low-voting areas span the entire urban-rural spectrum. On the map, rural areas and small towns may dominate visually. But there are far more potential votes in low-turnout metropolitan counties.
Fifteen large central metro counties with low 2016 turnout
COUNTY CITY TURNOUT
Norfolk City, Va. Norfolk 44%
Bexar County, Tex. San Antonio 48%
Bronx County, N.Y. Bronx, New York City 48%
Queens County, N.Y. Queens, New York City 50%
Kings County, N.Y. Brooklyn, New York City 50%
Shelby County, Tenn. Memphis 51%
Harris County, Tex. Houston 52%
Riverside County, Calif. Riverside 52%
Baltimore City, Md. Baltimore 52%
Davidson County, Tenn. Nashville 52%
Dallas County, Tex. Dallas 52%
Oklahoma County, Okla. Oklahoma City 53%
Tarrant County, Tex. Fort Worth 54%
Richmond County, N.Y. Staten Island, New York City 54%
St. Louis City, Mo. St. Louis 55%
There are low-voting counties even in the cores of some of the nation’s largest urban areas, including four of New York City’s five boroughs, as well as part or all of Houston, Dallas, Memphis, St. Louis, Baltimore and Oklahoma City.
They also vary in their racial makeup. Low-turnout counties include more than 400 that are predominantly (more than 80 percent) white. But in another 200, nonwhites are a majority, often including a significant Hispanic population.
Majority non-white counties with low voter turnout Predominantly white counties with low voter turnout
There are demographic traits that consistently set apart places where people don’t vote. The most well-known is education. In more than 700 low-turnout counties, a majority of people had attained only a high school diploma or less schooling. In comparison, education beyond high school is far more common among high-voting counties.
Share of counties with low, average or high turnout in 2016, by education level
0
20
40
60
80
100%
Least educated counties Most educated counties
The map also highlights stark differences between states, with high-voting areas just across the border of low-voting states such as West Virginia and Tennessee. In some cases, states differ in how convenient it is to register and vote. Six of the top seven highest-voting states allow voters to register on Election Day. In Colorado, Oregon and Washington, residents get a ballot by mail, and can vote by mailing it back.
Stark differences in neighboring states also reflect in part the differing culture and traditions in areas such as civic involvement and in minority relations, said Jay Barth, a politics professor at Hendrix College in Arkansas.
Share of adult citizens who voted in 2016
Average
turnout
Lowest
Highest
St. Louis
45%
55
65
75
MO.
OHIO
N.C.
TENN.
W.VA.
ARK.
VA.
Missouri and Arkansas Tennessee and North Carolina, Ohio, West Virginia and Virginia
For midterm elections like 2018, turnout is even worse than in presidential years, lower by about 20 percentage points, and trending down. Since 1800, there have been only three midterms with turnout lower than in the last midterm in 2014, according to figures compiled by Michael McDonald, a political science professor at the University of Florida.
But McDonald and others are expecting higher turnout in November. And some are looking for signs that 2018 marks a shift in voter participation that changes the nation’s political map. There are more competitive races, and voters are paying more attention.
A recent Washington Post-ABC News poll found that voters are significantly more interested in voting than they were four years ago. It was especially true for young people under 25, whose turnout in 2016 laggedthe national average by 18 percentage points, and for nonwhites.
As of Tuesday, Cook Political Report rated 72 House races as competitive, dozens more than in the same week of 2014. Those competitive districts include part or all of 121 counties that were low-voting.
Where low-turnout counties intersect competitive House races
WASH.
MONT.
N.Y.
NEV.
OHIO
N.M. 2nd District
Higher Hispanic turnout
could aid the Democrat in
this Trump +10 district.
ILL.
W.VA.
VA.
UTAH
KAN.
CALIF.
KY.
N.C.
N.M.
ARIZ.
S.C.
W.Va. 3rd District Trump won here
by almost 50 points, but analysts consider
the House race competitive.
ARK.
TEXAS
Tex. 23rd District A noteworthy Texas Senate matchup could drive turnout in this toss-up border district.
More competitive races could fuel greater voter participation because competition drives voter interest. More close races could even push up turnout in swing states where tiny winning margins of a fraction of one percentage point showed in 2016 how relatively few votes could be decisive. President Trump won Wisconsin by 0.8 of a percentage point, Pennsylvania by 0.7 and in Michigan by only 0.2.
“There is something that happens from living in a state where there is actually campaign activity, and voters sense that their vote matters, because the parties have invested time in running advertisements and reaching out to them,” said Barry Burden, director of the Elections Research Center at the University of Wisconsin-Madison.
Those sharp state lines that appear on the voting map, often following the boundaries between states with competitive races and those without, could begin to blur.
“It will be interesting to see if turnout is up in some of those places this year because they have become competitive after long periods of not being competitive,” Burden said. “That may be kind of a signal as to what we might see in the next electoral college vote where some of these states come into play.”