 Counting the victims of police violence
By Jazelle Hunt, NNPA Washington Correspondent
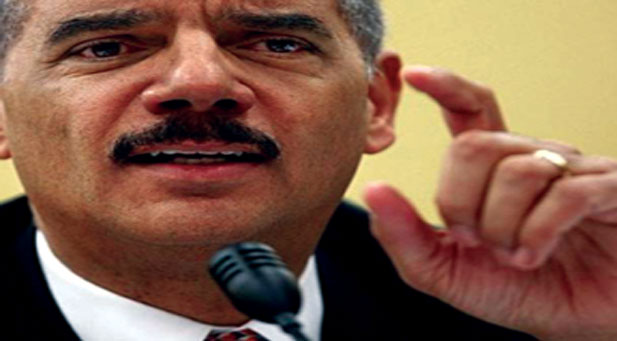
WASHINGTON, D.C. (NNPA)—As Eric Holder ended his tenure as U.S. Attorney General, he said, “The troubling reality is that we lack the ability right now to comprehensively track the number of incidents of either uses of force directed at police officers, or uses of force by police,” he said, at a Martin Luther King Jr. Day event. “This strikes many – including me – as unacceptable.”
As it stands, both the Federal Bureau of Investigation and the Department of Justice compile information on police killings, as reported by police departments themselves. But there are challenges with the reliability with this data. By law, collecting and providing this information to the government is mandatory only for police agencies that receive certain federal funds; police killings found to be unjustified are not included in the FBI’s measures; and reporting guidelines can vary from place to place, to name a few issues.
Over the past few years, citizens have attempted to step in where official entities would not, creating well-regarded crowdsourced online databases such as KilledbyPolice.net, FatalEncounters.org and the U.S. Police Shootings Database (launched by Web sports blog, Deadspin).
MappingPoliceViolence.org is the newest addition to this effort. Mapping Police Violence builds on this tally by merging and crosschecking those first two databases. It compiles a month-by-month death toll for 2013 and 2014; and by combing through media reports and other public data, the contributors have confirmed the race of every victim in 2014.
Samuel Sinyangwe, a 24-year-old Ferguson protester and one of the project’s directors, said that this detail is missing for approximately 60 percent of the victims in the source data-bases.
Though the project high-lights the disproportionate killing of Black people, it includes all reported deaths by date, location, race, age, gender, cause of death, and medical condition (e.g. under the influence, men-tally disabled, etc.). Additionally, users can compare police departments around the country by population, murder rate, and how “likely to threaten Black life” they are.
“When you compare white folks and Black folks who were killed by police, there are big differences. White folks tended to be more likely to have a mental illness, to be armed, to be older… or to be drunk or under the influence. So they were more likely to have some condition that made it more challenging for police to deal with them,” Sinyangwe says.
“However for Black folks, they were less likely to do all of these things, and then they were still more likely to be killed. You can only do that analysis if you looked at all races and were able to compare and contrast.”
By Mapping Police Violence’s count, police killed at least 1,175 people in 2014. Of these victims, 302 were Black – a disproportionate rate of 26 percent – and 56 percent of these Black victims were unarmed. Most victims were shot, but other causes of death included Tasing, physical restraint, being hit by cars, and in one case in New York, falling from a window.
Counting the victims of police violence
“What you can show quite plainly with this tool is that, in fact, places with the same amount of crime, the same demographics, have very different levels of police violence. So crime is not an excuse,” Sinyangwe said. “We’re hoping to really help [communities and organizers] make the case for why a given city or police department is really culpable for this and really needs to make a change.”
According to the data, Florida, Texas, and California had the highest number of Black victims last year (each responsible for between 20 and 35 deaths). Police departments responsible for the most deaths last year include Chicago Police Department (13 killed), followed by Los Angeles and New York (10 each), and Prince George’s County Police Department in Maryland (five deaths).
Sinyangwe points out that for the city of St. Louis, if the current trend continues; Black males 27 and younger will have a statistically greater chance of being killed by police than dying in a car accident.
The data also shows a marked drop in police killings after Michael Brown’s death and the start of the Ferguson protests. In August 2014, police killed 140 people around the country, 43 of them Black; the next month, those numbers fell to 80 and 19, respectively. They still have not returned to their Au-gust 2014 levels, for any demographic.
MappingPoliceViolence.org is run by Ferguson protesters and organizers, and is a project of the movement’s online hub, WetheProtesters.org. Volunteers around the country contribute to, sort, and verify the in-formation.
“What I hope, and what DeRay [McKesson], [Johnetta Elzie], and I are building the capacity to do, is to use this tool to support groups on the ground… to be able to really make the case, using the best data available, for long-term institutional change,” Sinyangwe says.
“Particularly in the Midwest, and then a little bit in the South, there really are hotbeds for police violence. The question is, can we actually do something on a preventative end instead of waiting until a huge tragedy happens?”


Be the first to comment